Last Updated: August 2026
Finance Dashboard
Overview —
Problem
I wanted a clearer picture of my spending, but manually entering every transaction into a spreadsheet was tedious enough that I never maintained a finance tracker consistently.
Solution
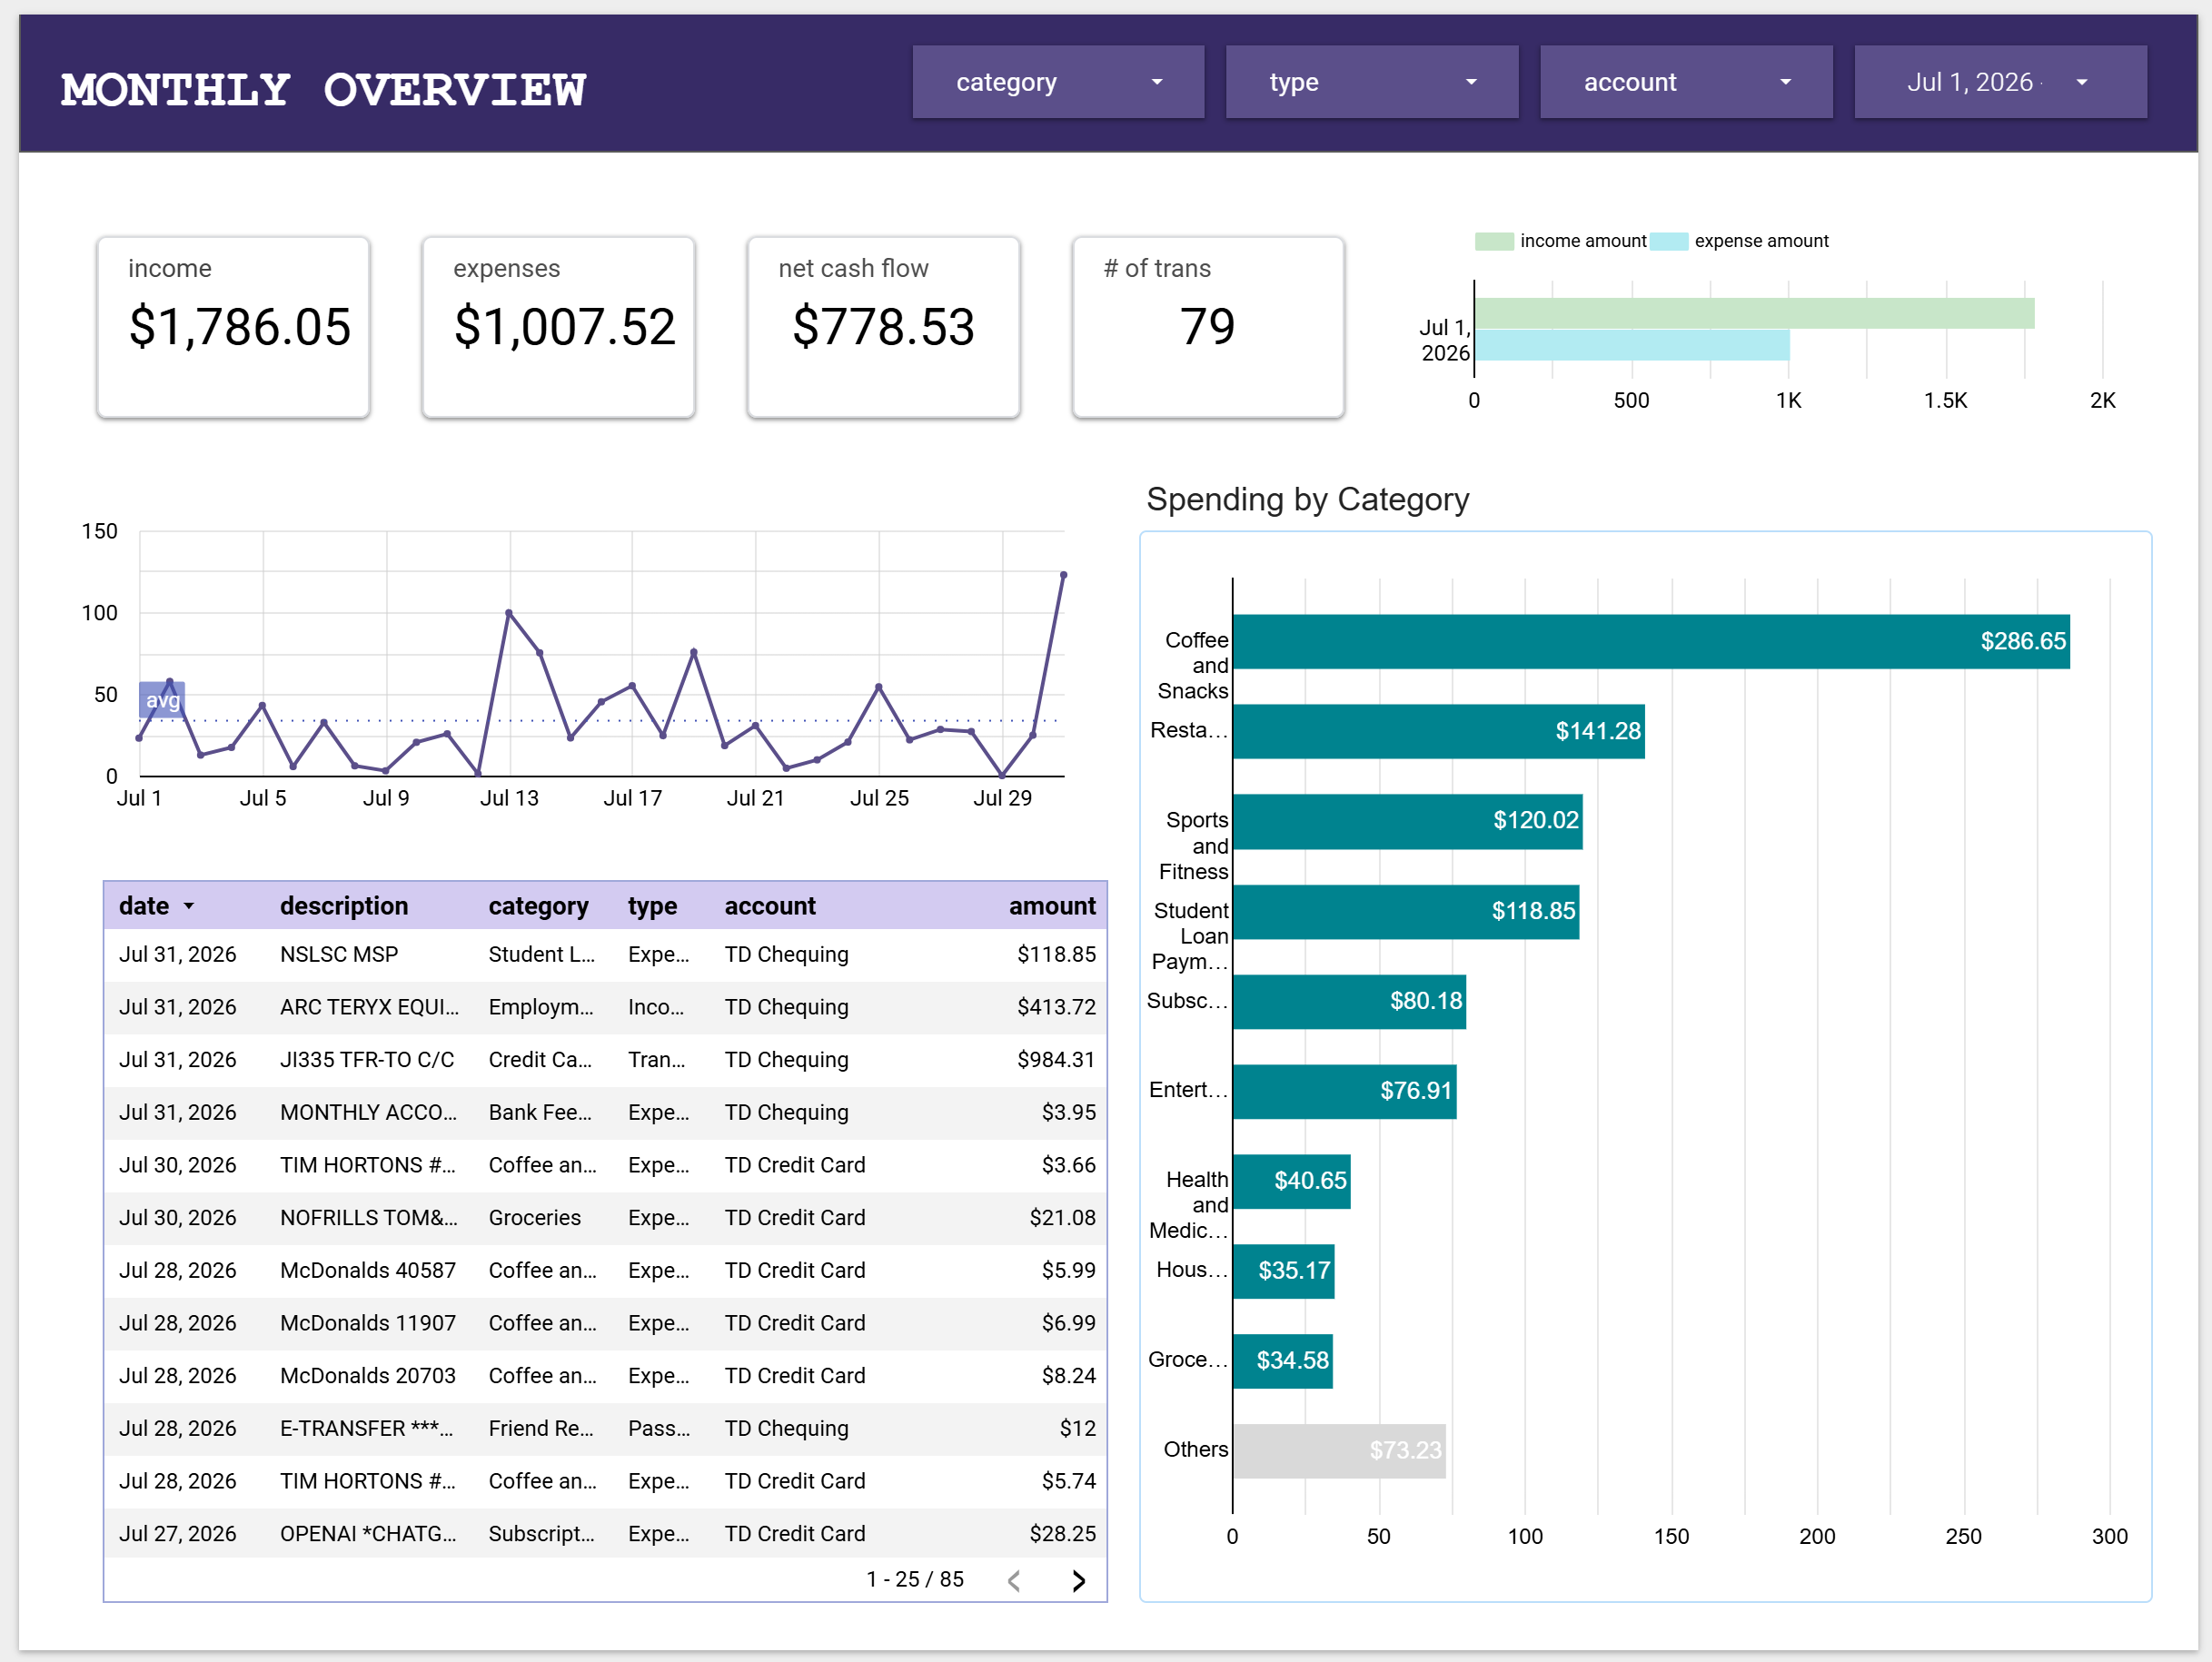
I built a semi-automated workflow using Google Sheets, Apps Script, Google Drive, and Looker Studio that imports bank transactions for review and categorization, stores them in a structured dataset, and feeds an interactive personal finance dashboard.
Impact
The system turned a finance-tracking habit I struggled to maintain into a much simpler monthly workflow. It also taught me to think beyond the dashboard itself and consider the full data process, from importing and cleaning information to structuring it for useful analysis.
Tools
Looker Studio (Google Data Studio)
Google Sheets
Google Apps Scripts
How It Works
Bank CSVs → Google Drive → Apps Script → Import Review → Transactions Dataset → Looker Studio
Each month, I download chequing and credit card transaction files and place them in a designated Google Drive folder. Apps Script reads and standardizes the data, loads it into an Import Review sheet, and then moves approved transactions into a master dataset that feeds the dashboard.
I kept categorization as a manual review step so I could still apply judgment while automating the repetitive parts of the workflow.
Details for nerds —
Challenges & Lessons
Standardizing different transaction sources
Chequing and credit card exports use slightly different structures, so I had to normalize fields like dates, amounts, account types, and descriptions before combining them into one dataset.
Handling transfers correctly
Not every transfer of money is income or spending. Credit card payments and other transfers needed to be classified separately so the dashboard did not double-count them.
Designing for maintainability
The biggest lesson was that a finance tracker is only useful if I can keep using it consistently. Automating the repetitive steps while keeping a quick manual review made the process much more sustainable.
What I Learned
This project helped me think about data work as an end-to-end process rather than just a visualization task.
I gained practical experience with importing, cleaning, categorizing, and structuring data before it ever reached the dashboard, and learned how much the quality of a final visualization depends on the workflow behind it.